
Configure number widgets to display key metrics in your dashboard
The section here details various configuration options available for the Number widget in NocoDB dashboards. This widget is designed to display key performance indicators (KPIs) and metric summaries in a clear, concise format.
สั่งงานด้วย NocoAI
Add a metric widget showing the total [Amount] this [quarter]Add a metric widget showing the number of [open] [tickets]Add metric widgets for [total, open and closed] [tasks] in one row
Title & description
- Title : Enter a title for the number widget. This will be displayed prominently at the top of the widget.
- Description : Optionally, add a description to provide context or details about the metric being displayed. This will appear below the title.
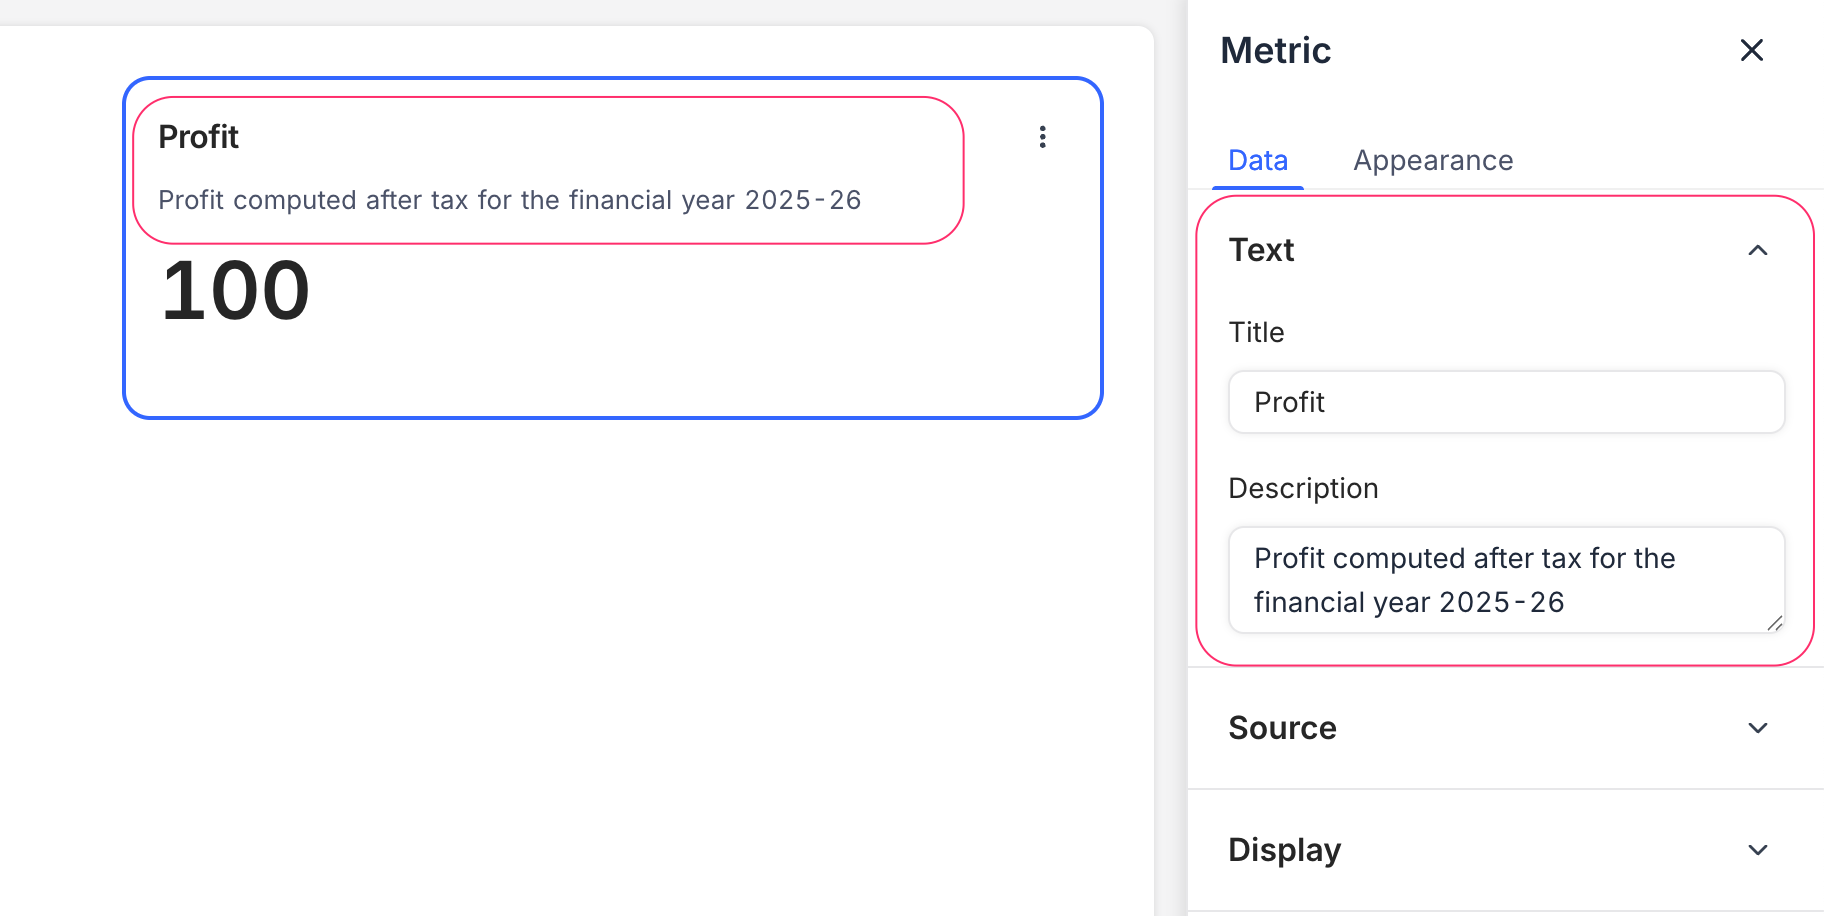
Data source
- Table : Select the table from which you want to pull data for the number widget. This is the primary source of records for the metric.
- Record : Select records from the chosen table to be included in the metric calculation. You can choose from:
- All Records : Displays the total count of records in the selected table.
- Records from a view : Allows you to filter records based on a specific view, enabling focused metrics. You need to select a view from the dropdown.
- Specific Records : Apply filters to select specific records for the metric. This is useful for showing metrics based on certain criteria. You can add multiple filters to refine the selection.
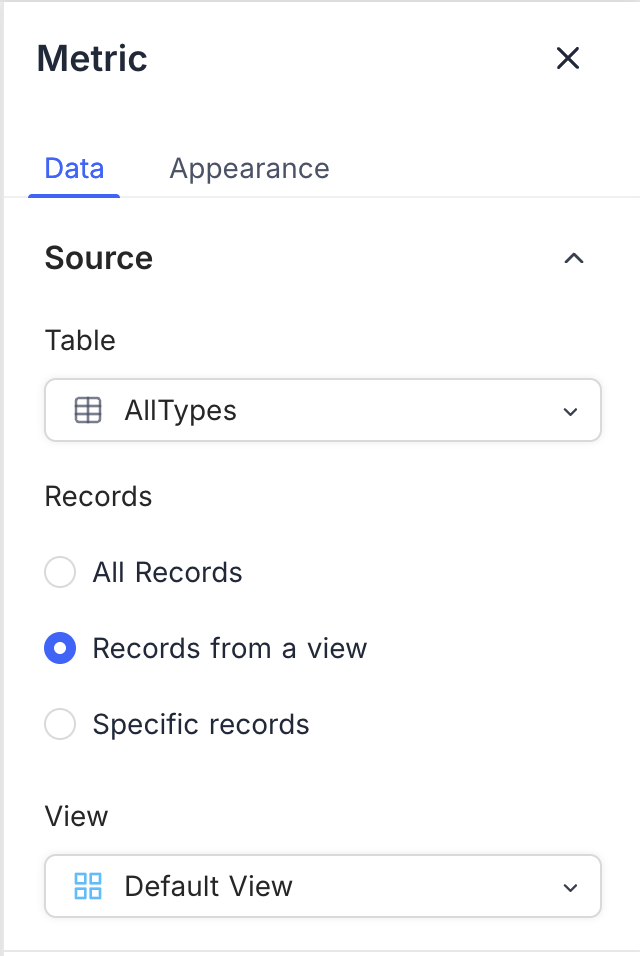
<img src="/img/v2/dashboards/widget-number-source-2.png" alt="Number Widget Config 2" style={{ width: "30%", minWidth: "240px", borderRadius: "8px", border: "1px solid #ddd" }} />
Display
- Record Count : Displays the total number of records in the selected source.
- Field Summary : Shows the sum, average, minimum, maximum, or count of a specific field across the selected records. Available options vary based on the field type.
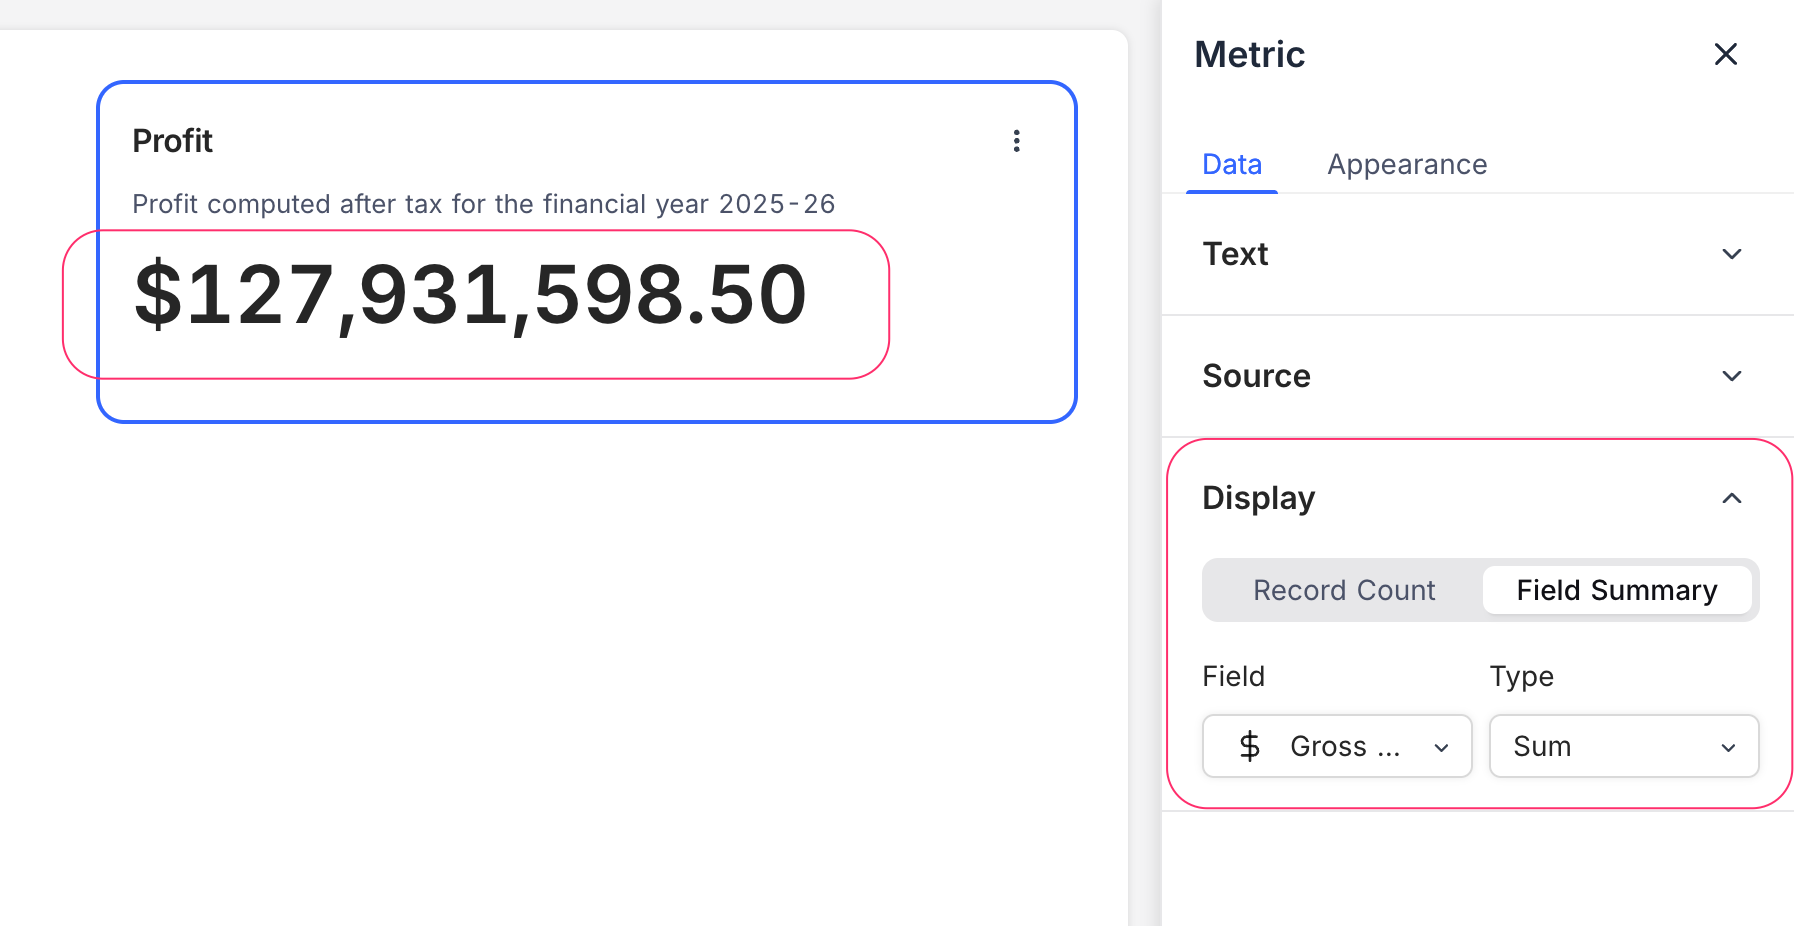
Appearance
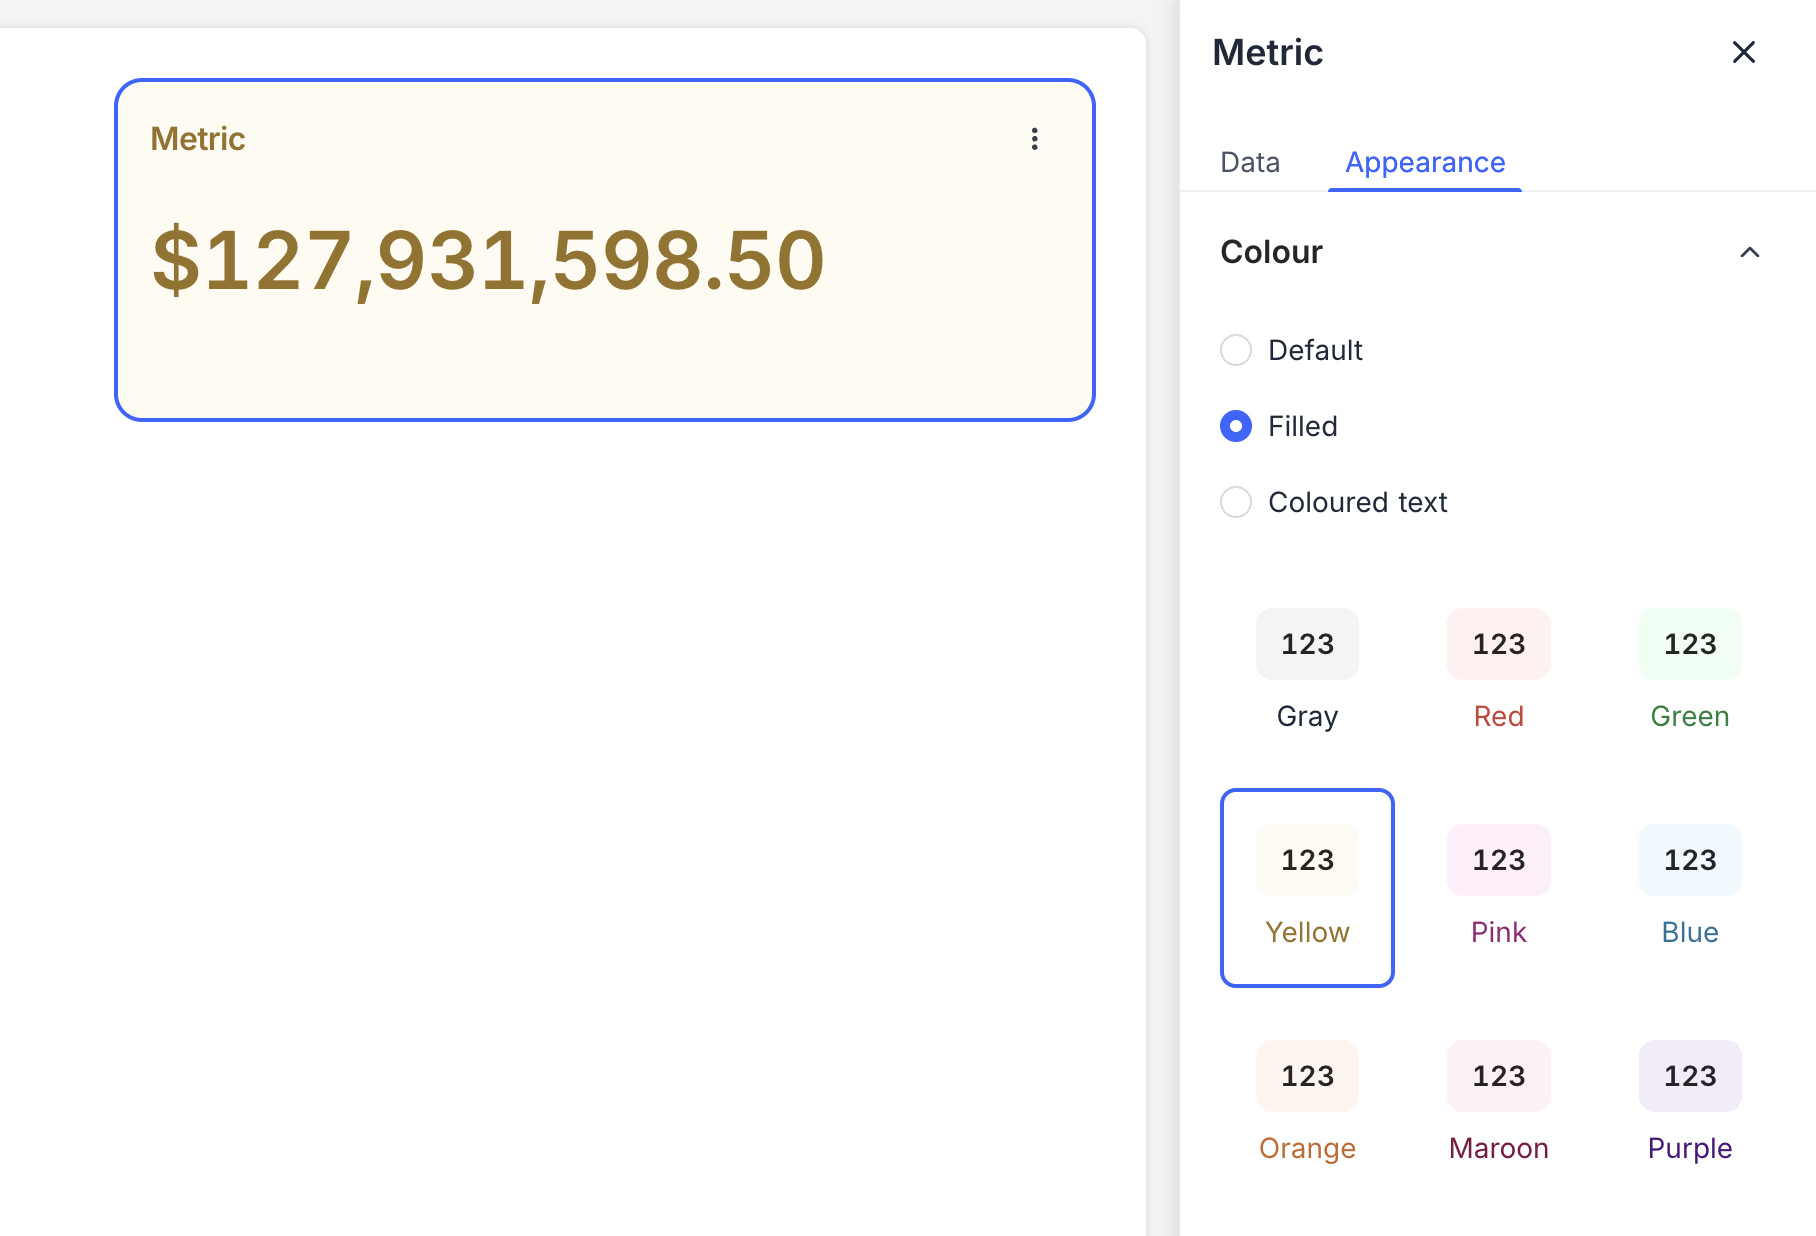
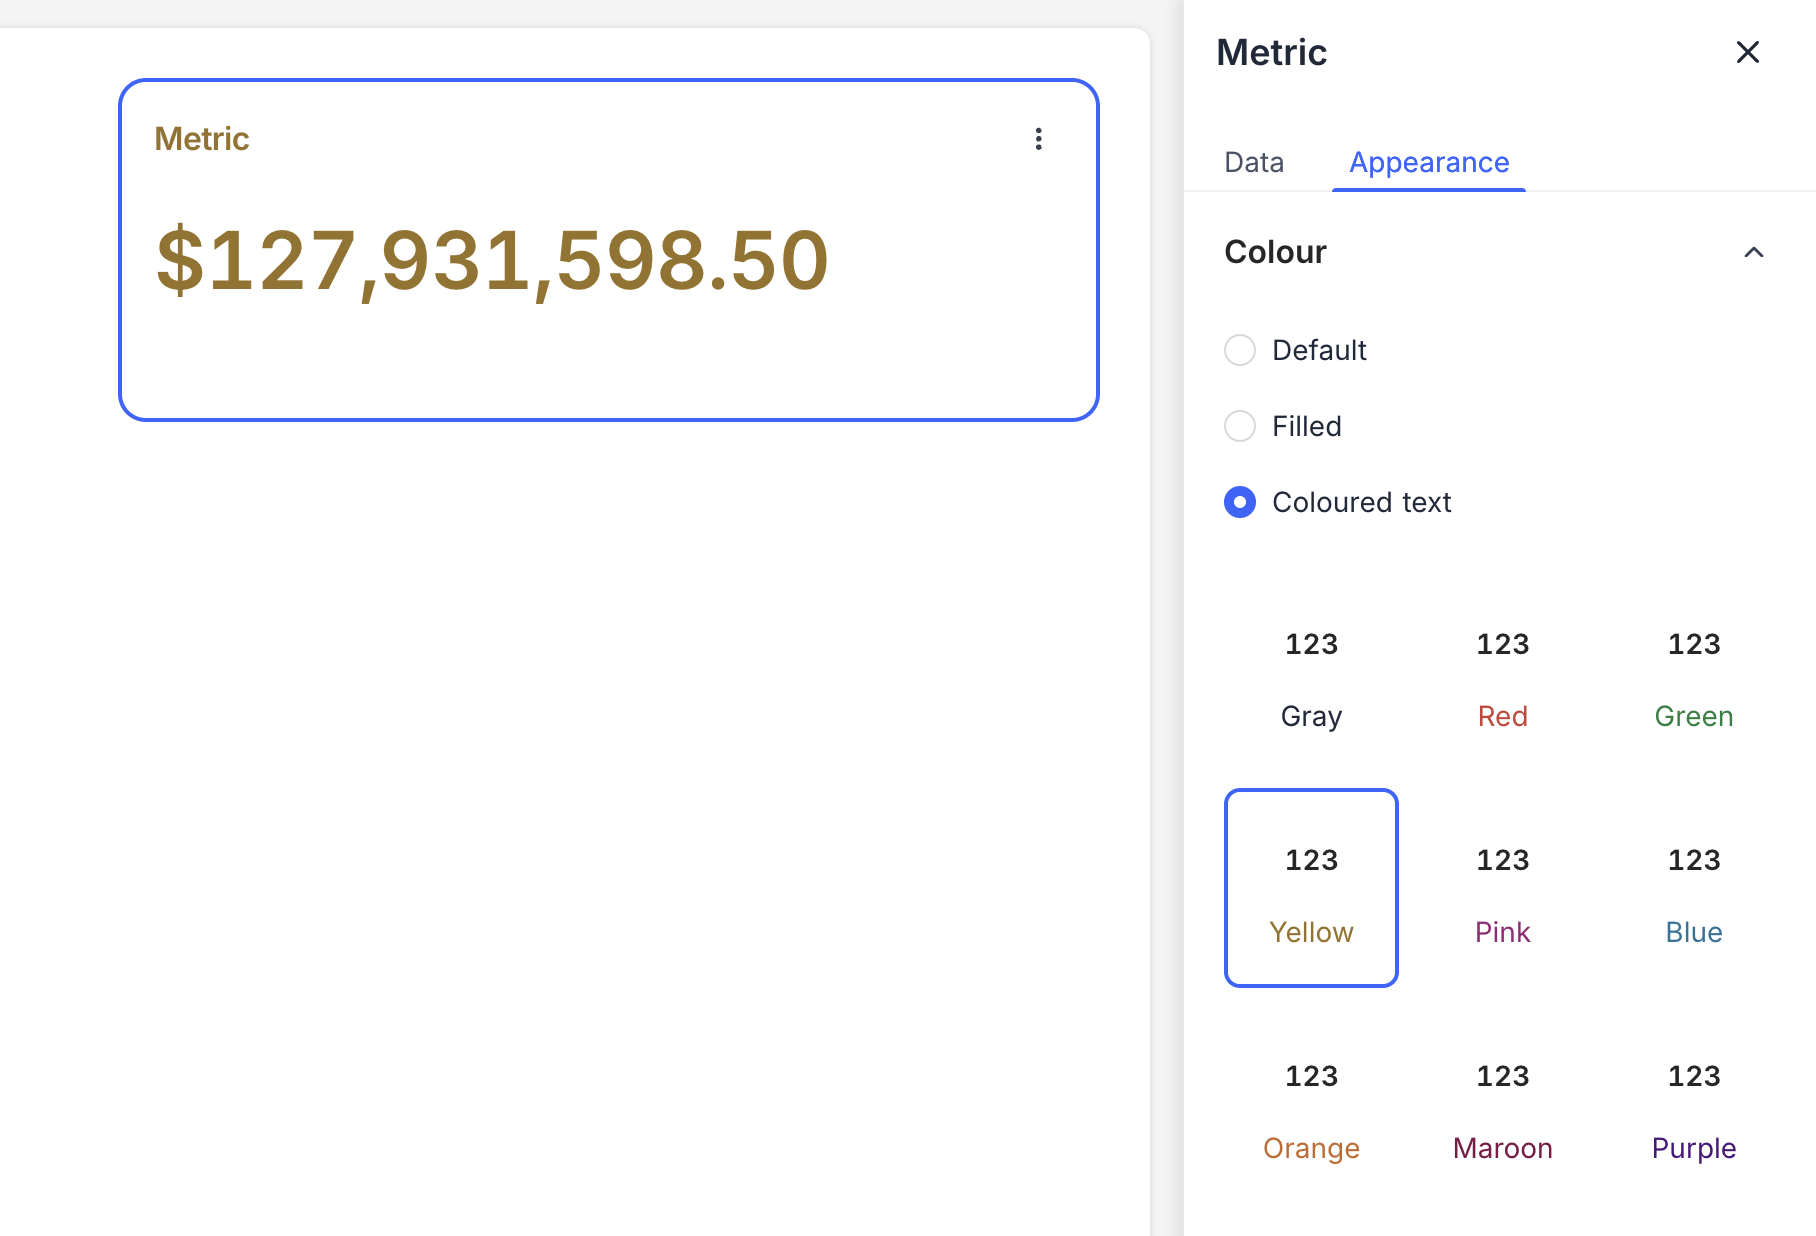
Number Format : Choose how the number is displayed, such as:
- Default : Standard numeric format.
- Filled : Displays the number with a filled background.
- Coloured Text : Uses color to highlight the number, making it stand out.
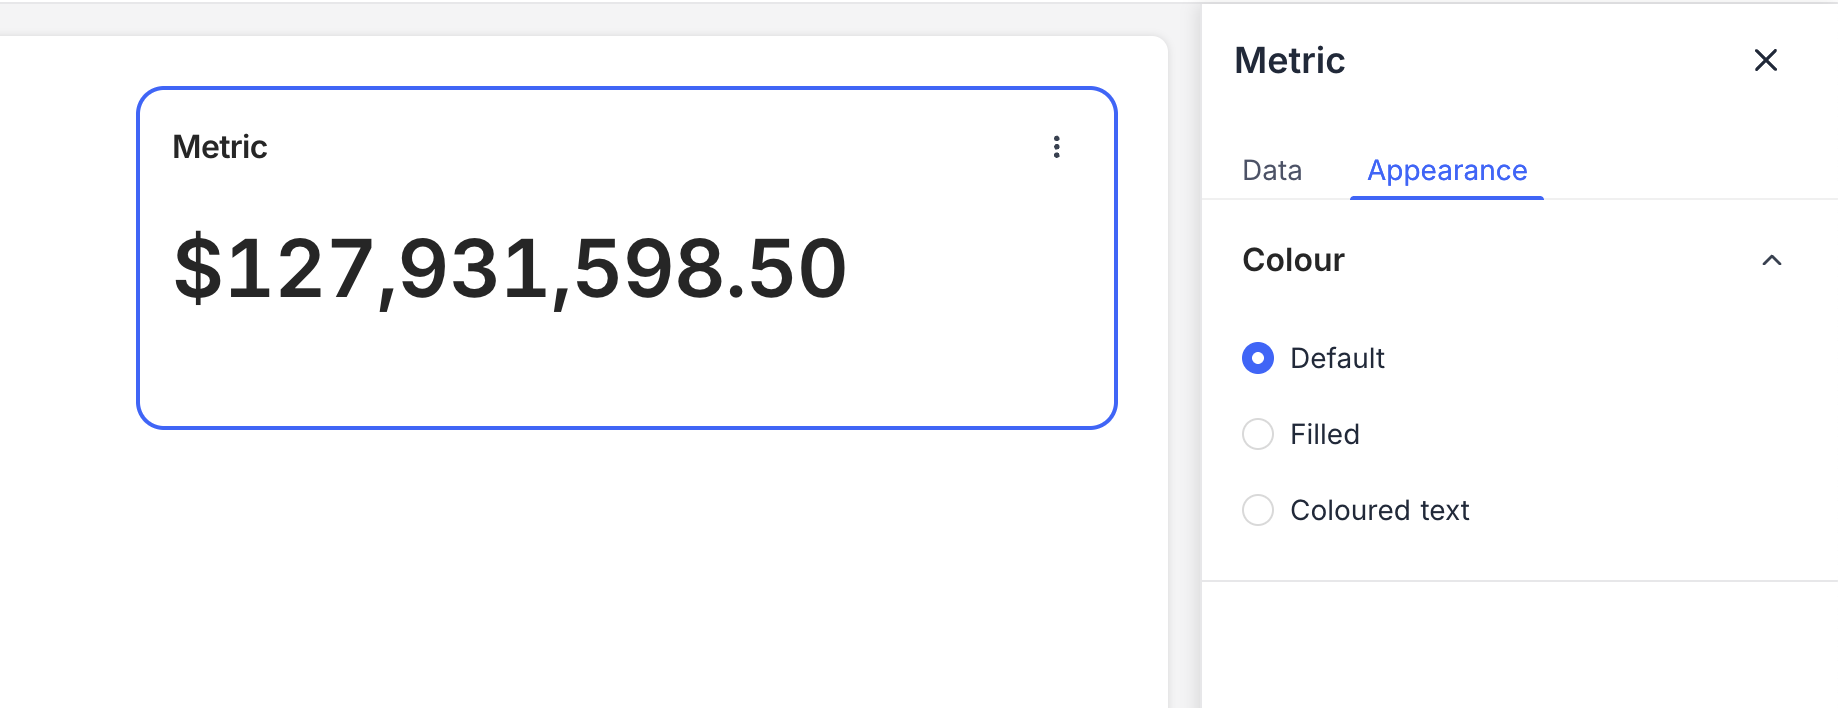
Related pages
- Text : Configure text widgets to add static textual content to your dashboard
- Bar Chart : Configure bar chart widgets to compare values across categories in your dashboard
- Line Chart : Configure line chart widgets to visualize trends and comparisons over time or categories in your dashboard
- Pie Chart : Configure pie chart widgets to visualize data distribution in your dashboard
- Donut Chart : Configure donut chart widgets to visualize data distribution in your dashboard
- iFrame : Embed external content securely inside your dashboard using the iFrame widget