
Configure text widgets to add static textual content to your dashboard
The section here details various configuration options available for the Text widget in NocoDB dashboards. This widget is designed to display descriptive content, instructions, notes, or disclaimers, helping you add context or guidance alongside your data visualizations.
สั่งงานด้วย NocoAI
Add a text widget at the top that explains what this dashboard tracksAdd a text widget with a heading for each section of this dashboardUpdate the text widget to include [who to contact about this data]
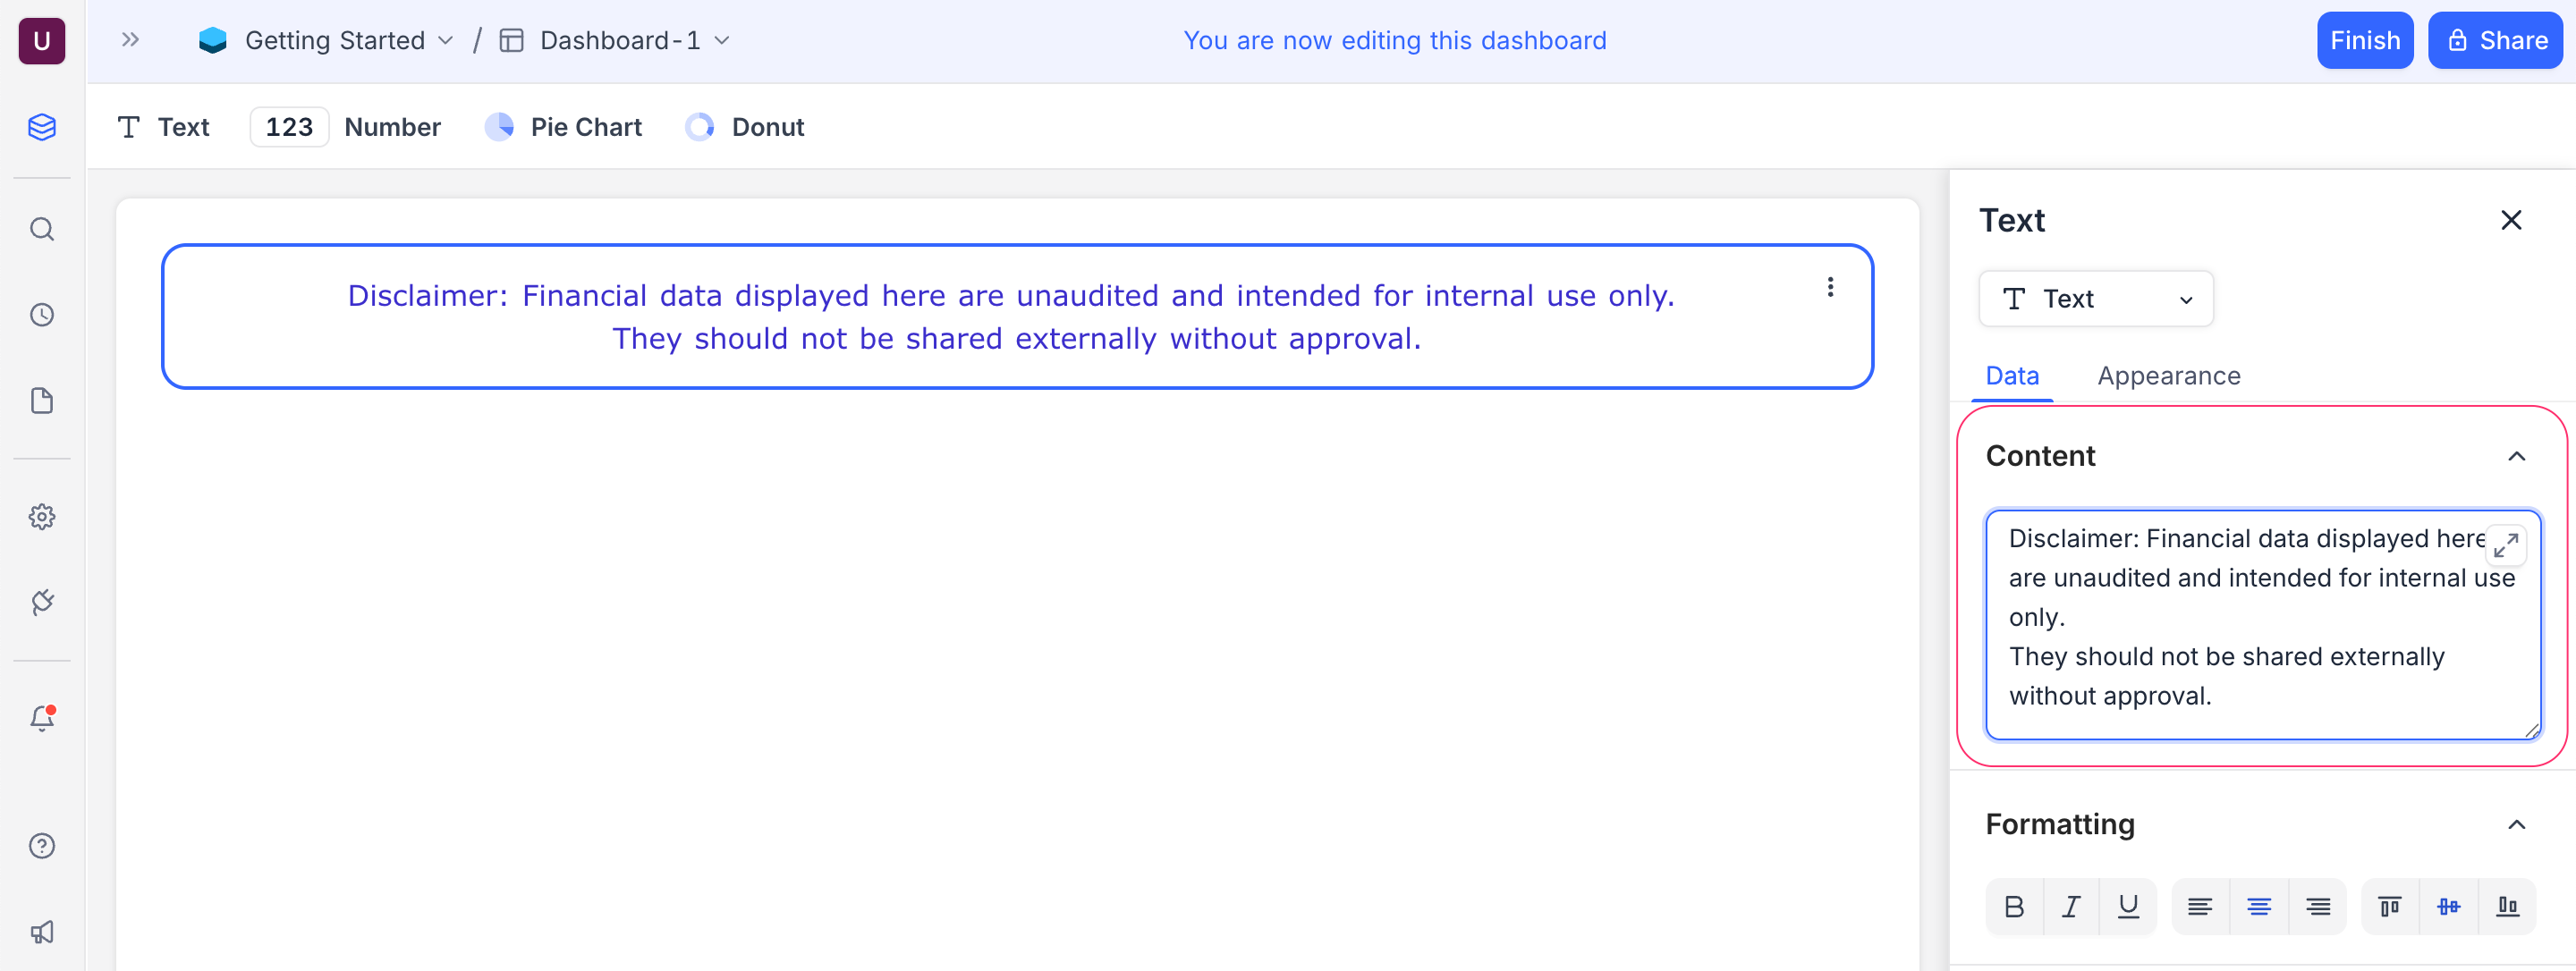
Content
Type the text you want to display. This can be:
- Instructions for dashboard users
- Explanatory notes for data insights
- Compliance or legal disclaimers
- Motivational or status updates for teams
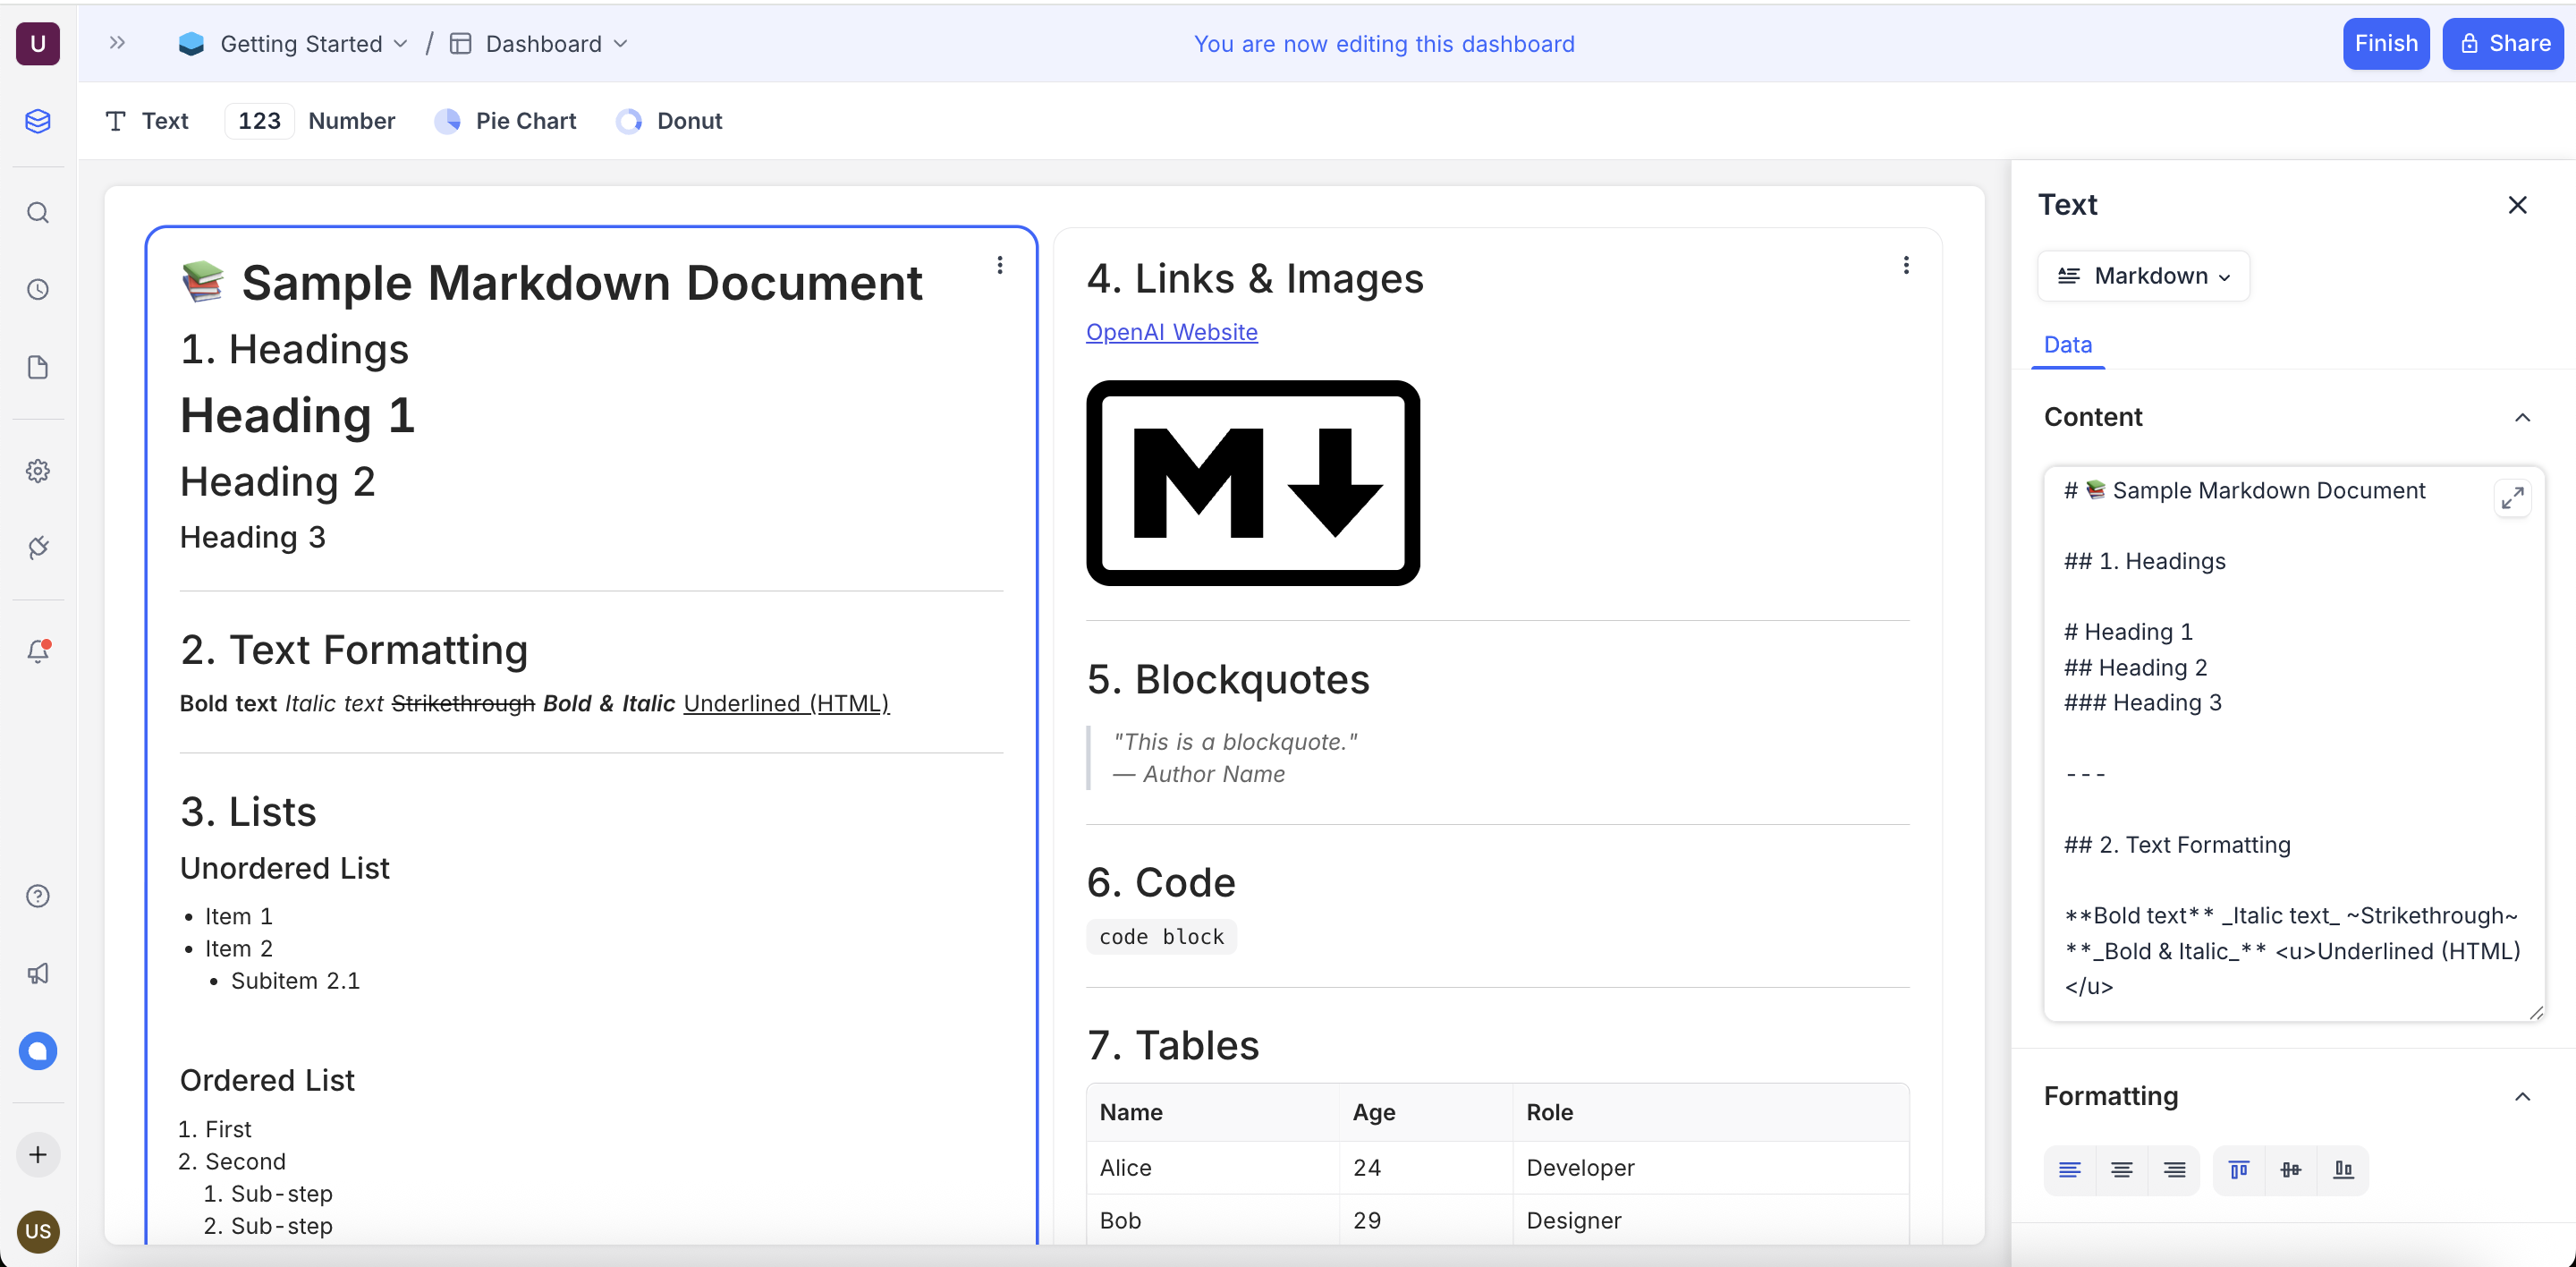
You can choose between two content modes:
- Markdown : Write using markdown syntax for headings, lists, links, images, blockquotes, code, and tables. Find more details about supported markdown syntax in the Markdown Guide .
- Text : Use the inline editor for direct styling.
Formatting
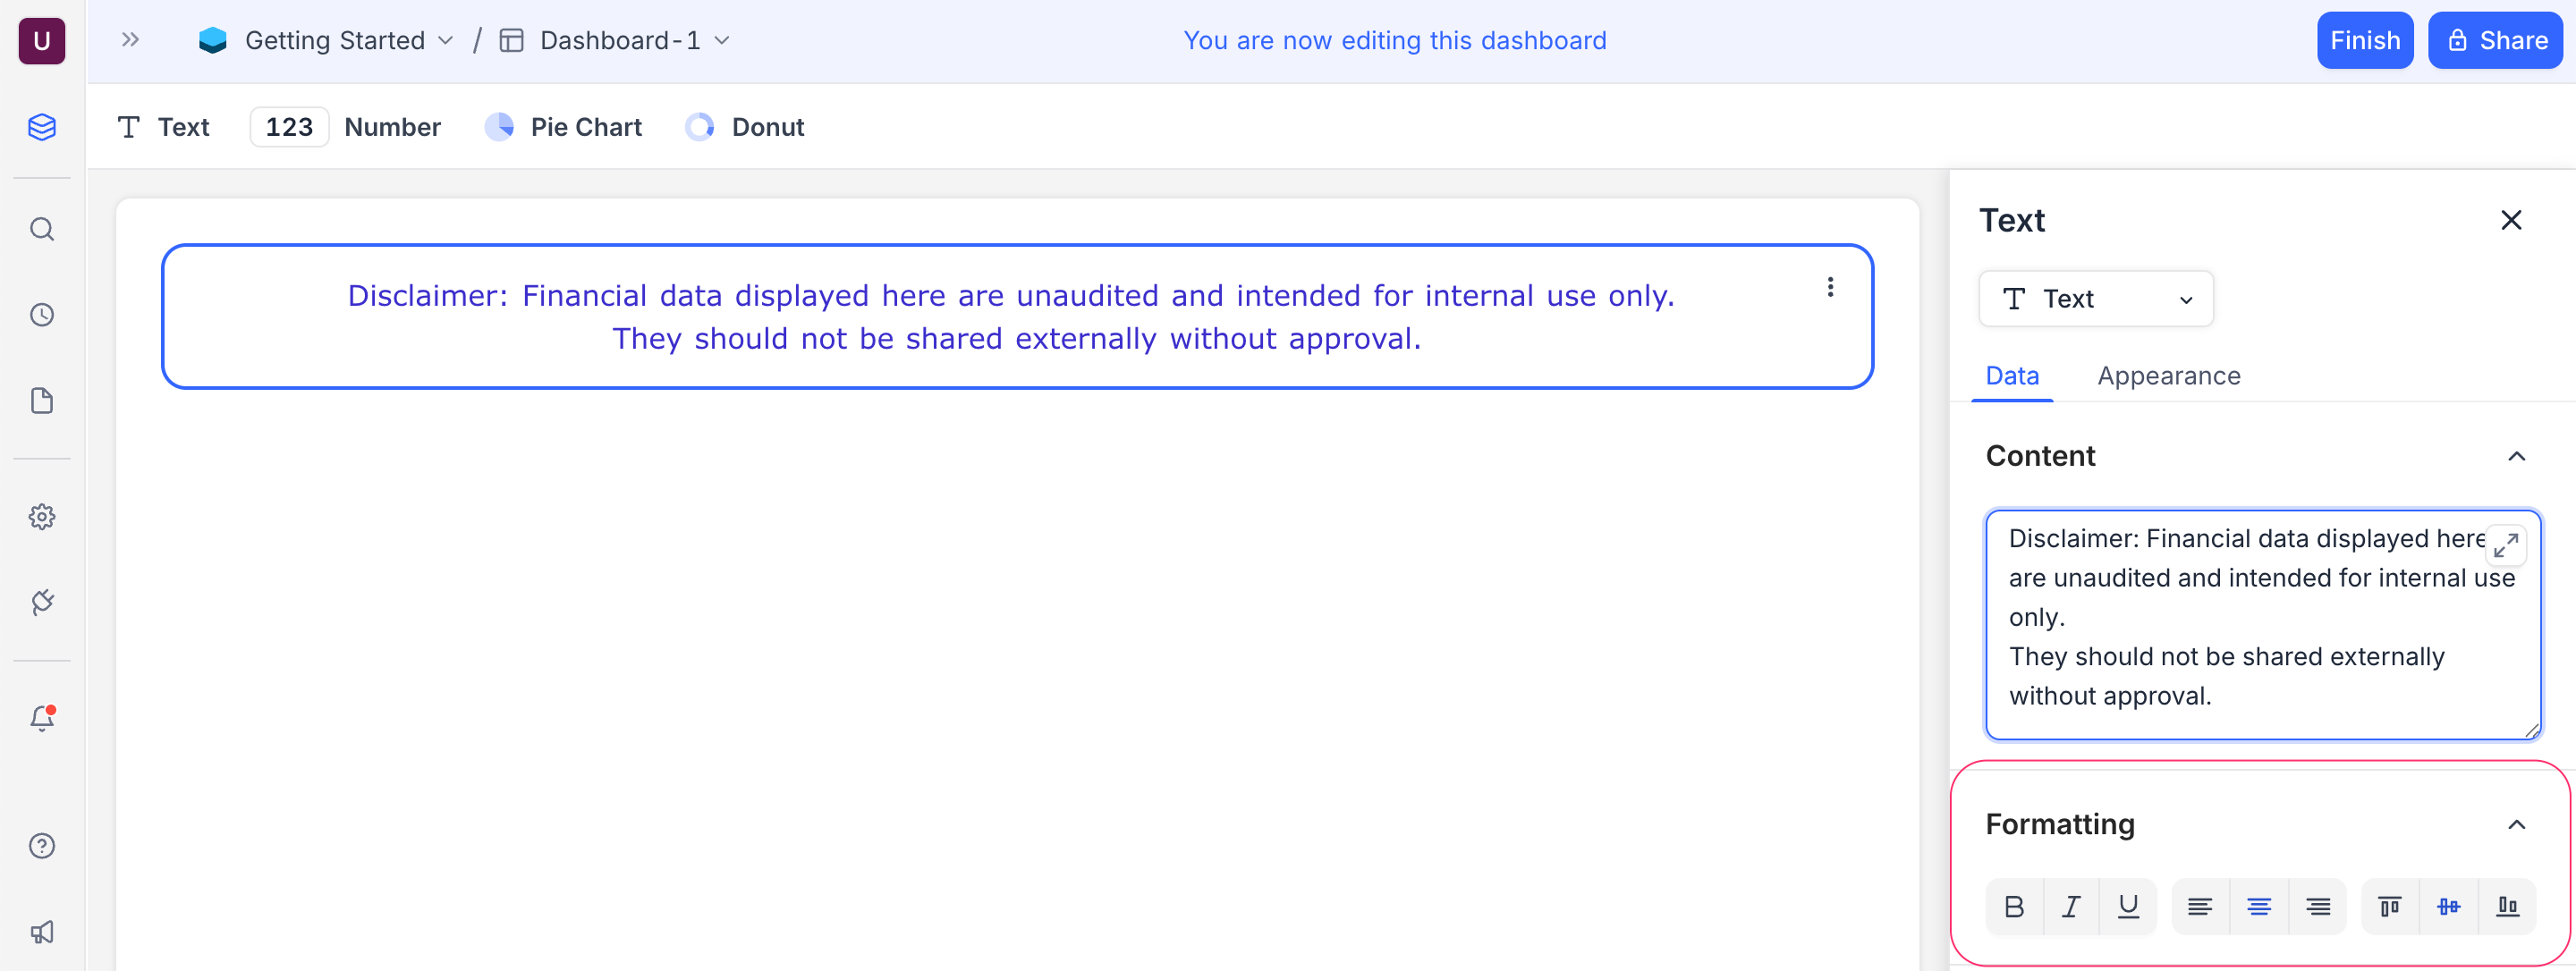
Use the inline editor to style your text:
- Bold , Italic , and underline for emphasis.
- Horizontal alignment ( left , center , right ).
- Vertical alignment ( top , middle , bottom ).
Appearance
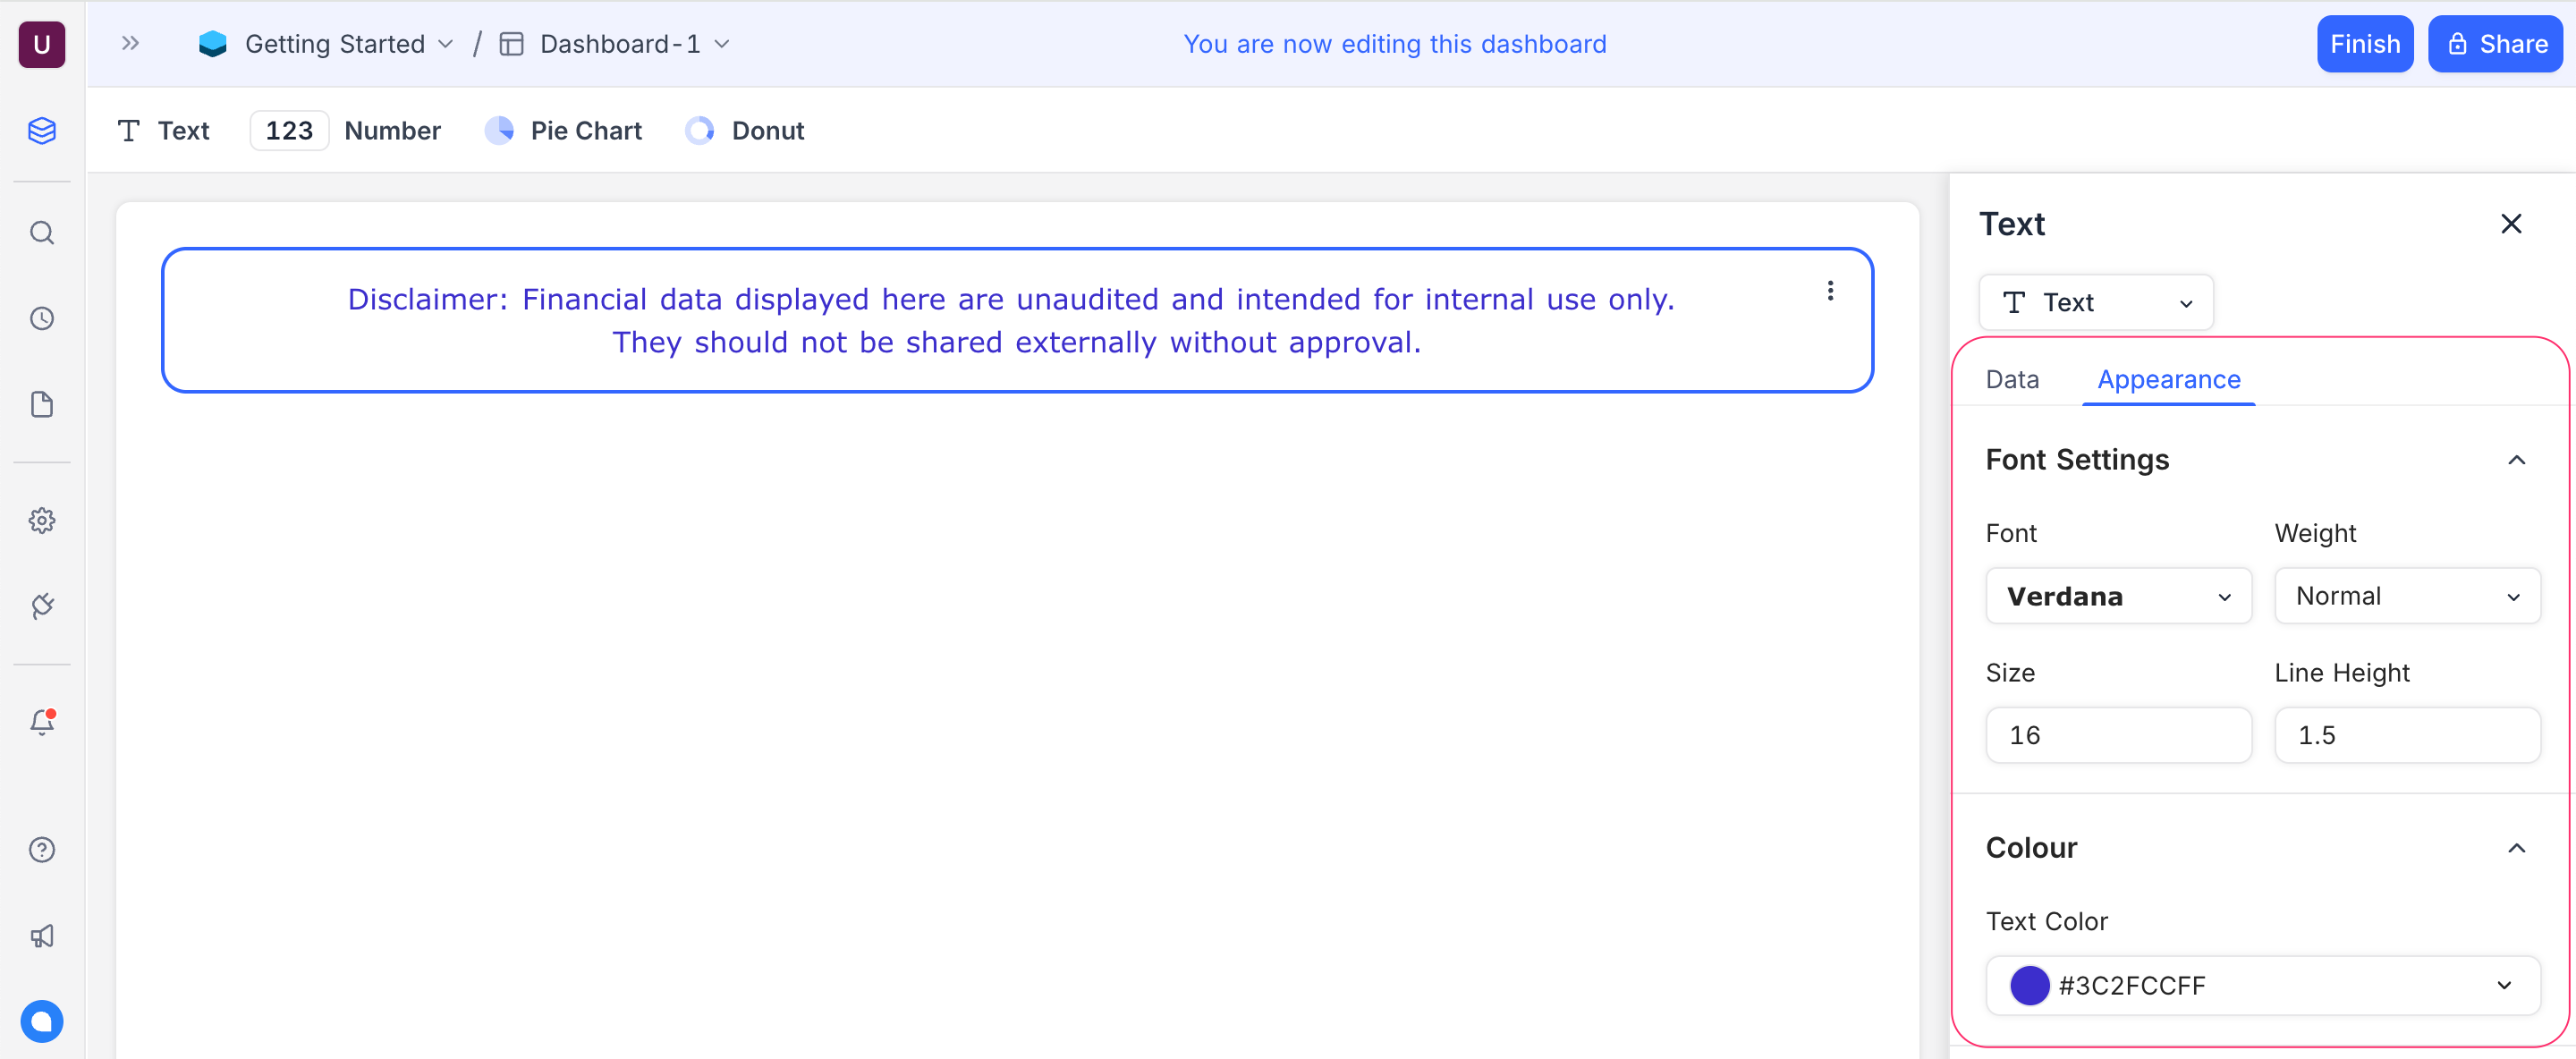
Customize how the text is presented in the widget:
หมายเหตุ: Appearance options are available only when the content mode is set to Text .
- Font : Choose from available font families.
- Weight : Set text thickness (e.g., Light, Medium, Bold).
- Size : Adjust the font size to suit your layout.
- Line Height : Control spacing between lines for better readability.
- Text Color : Select any color to highlight your content.
Related pages
- Number : Configure number widgets to display key metrics in your dashboard
- Bar Chart : Configure bar chart widgets to compare values across categories in your dashboard
- Line Chart : Configure line chart widgets to visualize trends and comparisons over time or categories in your dashboard
- Pie Chart : Configure pie chart widgets to visualize data distribution in your dashboard
- Donut Chart : Configure donut chart widgets to visualize data distribution in your dashboard
- iFrame : Embed external content securely inside your dashboard using the iFrame widget